Introduction
Beautiful, modern UI components for React applications.
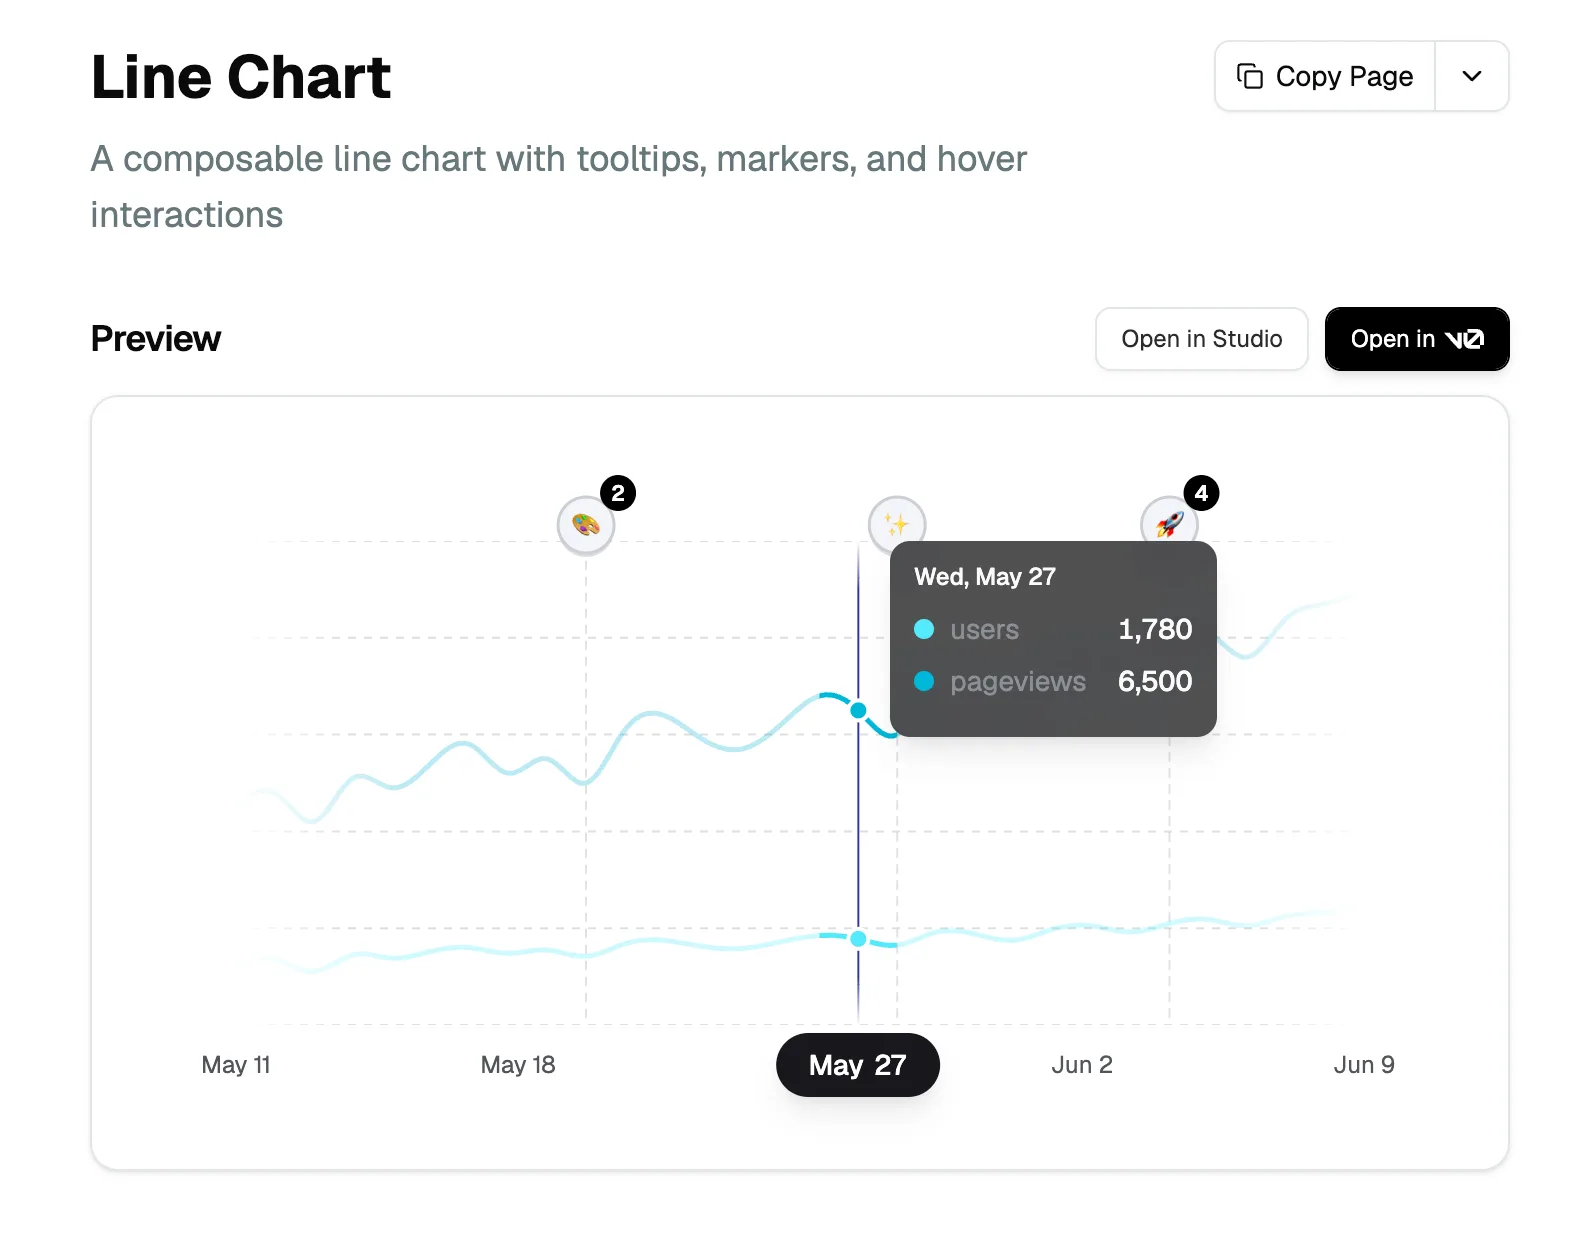
Bklit UI is a component library built on top of shadcn/ui to help you build charts and data visualizations more easily.
Usage
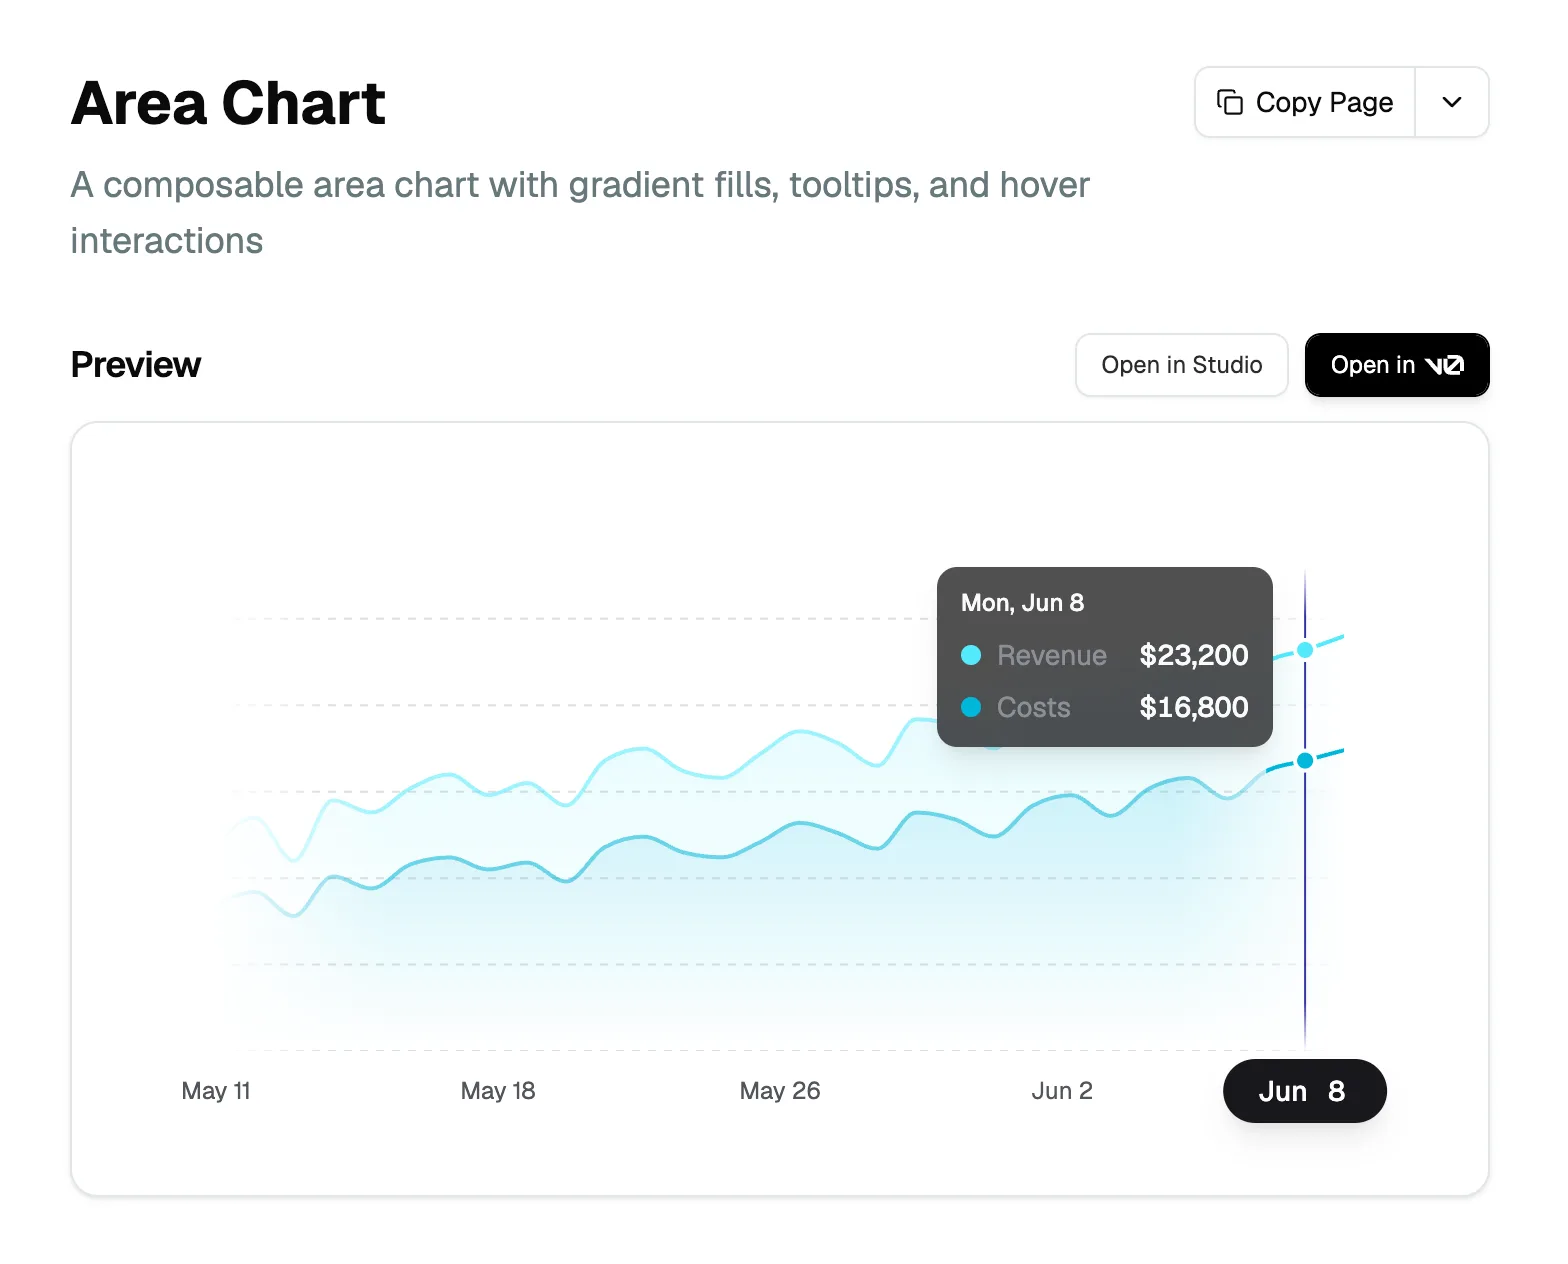
The Area Chart uses the same composable API as the Line Chart. See the charts gallery for interactive examples.
jsx
import { AreaChart, Area, Grid, XAxis, ChartTooltip } from "@bklitui/ui/charts";

const data = [
  { date: new Date("2025-01-01"), revenue: 12000, costs: 8500 },
  { date: new Date("2025-01-02"), revenue: 13500, costs: 9200 },
  // ... more data
];

export default function RevenueChart() {
  return (
    <AreaChart data={data}>
      <Grid horizontal />
      <Area dataKey="revenue" fill="var(--chart-line-primary)" />
      <Area dataKey="costs" fill="var(--chart-line-secondary)" />
      <XAxis />
      <ChartTooltip />
    </AreaChart>
  );
}